Pivot Table 1.xlsx
DashboardDataPivot TableEmployeeProducts
Selected work / 02 of 08 / Reporting & analytics
Summarize a large business dataset into filterable views with operational categories and reporting charts.
Discuss a similar project ↗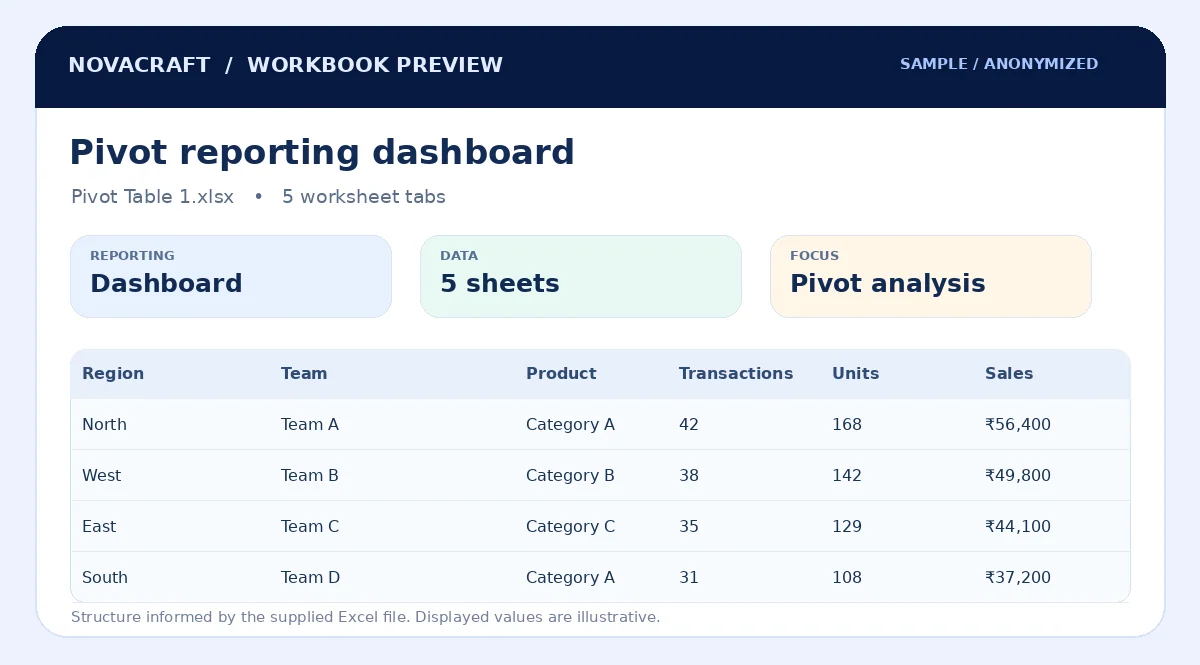
Column structure and sheet types are based on the supplied workbook. Rows below are example content, not extracted customer records.
| Region | Team | Product | Transactions | Units | Sales |
|---|---|---|---|---|---|
| North | Team A | Category A | 42 | 168 | ₹56,400 |
| West | Team B | Category B | 38 | 142 | ₹49,800 |
| East | Team C | Category C | 35 | 129 | ₹44,100 |
| South | Team D | Category A | 31 | 108 | ₹37,200 |
The worksheet names below are read from the original Excel archive.
Pivot Table 1.xlsx
Privacy: Public previews use representative example data. The original uploaded workbooks are not distributed through this website.